
SHRP 2 – Roadway Information Database
The SHRP 2 Project S04A was established to design, build, and populate a Roadway Information Database (RID) with data from the SHRP 2 mobile data collection project (S04B); existing roadway data from government, public, and private sources; and supplemental data that further characterize traffic operations.
Objective
The overall focus of this research was based on providing good quality data that are linkable to the SHRP 2 Naturalistic Driving Study (NDS) database and stored in a secure, flexible database that is accessible utilizing geographic information system (GIS) tools. The RID will in essence provide the road element for safety research on the more than 5 million trips taken by the NDS participants. The data will support a comprehensive safety assessment of driver behavior and crash risk, especially the risk of lane departure and intersection collisions. The RID will enable safety researchers to look at data sets of selected road characteristics and study matching NDS trips to explore the relationships between driver, vehicle, and roadway. This capability of the RID makes it a very useful tool for NDS users interested in roadway characteristics and features because it allows researchers to focus on only those NDS trips that traversed road segments containing the items of interest. In addition, the RID serves as a template on how transportation agencies can integrate data from disparate sources in an effort to improve decision making beyond just safety; and the RID has the potential to serve as a template for a national integrated database to support decision making in a performance measurement environment.
User Data Needs
In order to identify the data requirements of the RID, potential users were identified. A key purpose of the user identification effort was to facilitate the design of an integrated data set with data dictionaries suitable for stakeholders who are most likely to use the RID for safety and other research. Users were categorized based familiarity with roadway data and familiarity with GIS and spatial analyses, the type of analyses that will be conducted with the RID.
The next step was to identify the roadway data elements necessary to answer research questions using the NDS data. This effort included a broad range of safety-related research questions that users may ask. Webinars and a survey were used to refine the initial list of potential RID data elements into a prioritized list. The final list consisted of critical items necessary to help answer research questions related to run off road and intersection analysis. These data items were collected as part of the SHRP 2 mobile data collection project and included the following:
- Horizontal curvature:
- Radius
- Length
- Point of curvature (PC)
- Point of tangency (PT)
- Direction of curve (left or right based on driving direction)
- Grade
- Cross-slope/Superelevation
- Lanes: number, width, and type (thru, turn, passing, acceleration, car pool, etc.)
- Shoulder type/curb (and paved width, if it exists)
- All Manual on Uniform Traffic Control Devices (MUTCD) signs
- Guardrails/Barriers
- Intersection: location, number of approaches, and control (uncontrolled, all-way stop, two-way stop, yield, signalized, roundabout). Ramp termini were considered intersections.
- Median presence: type (depressed, raised, flush, barrier)
- Rumble strip presence: location (centerline, edgeline, shoulder)
- Lighting presence
Collection and Quality Assurance of Data
To assist SHRP 2 in the selection of a vendor to collect these data at highway speed, the research team used the results from the 2008 SHRP 2 S03 Roadway Measurement System Evaluation (Rodeo) project, which was conducted by a separate contracting team under Project S03, and supplemented these results with an additional evaluation that was conducted by the research team in 2010. This re-evaluation was accomplished by documenting each vendor’s ability to collect roadway geometric data and some selected inventory data features on two of the six Rodeo control sites. As a result, three vendors were invited to submit proposals to SHRP 2 in response to the request for proposals for the mobile data collection project. Fugro Roadware was the selected vendor.
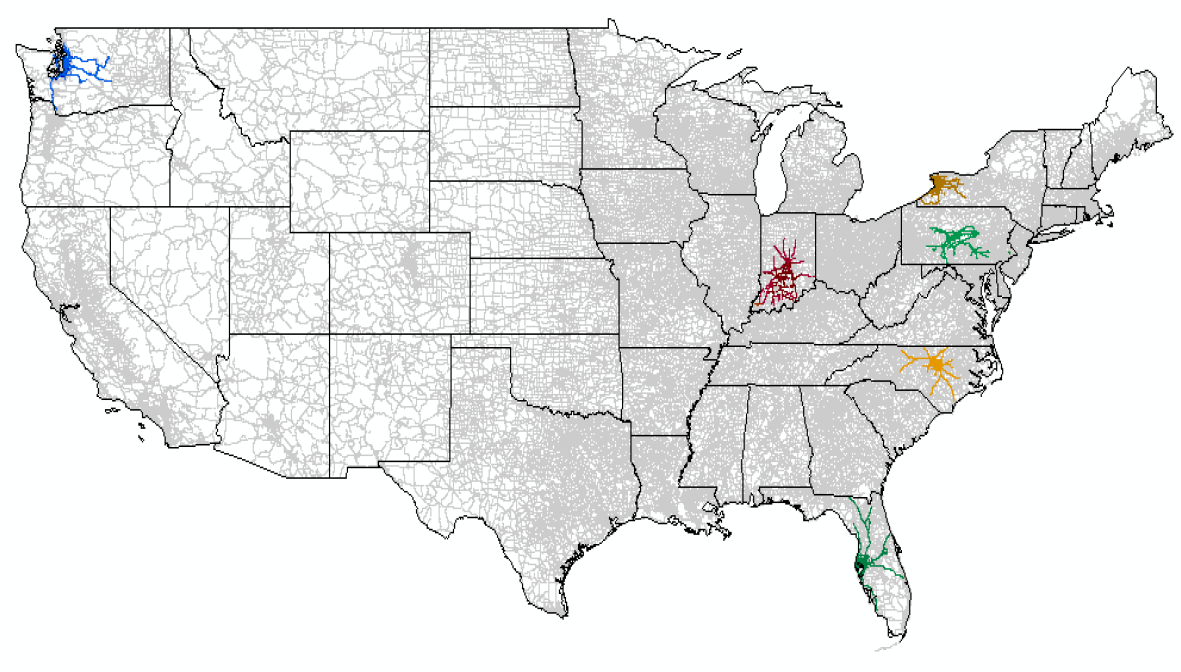
The objective of the mobile data collection project was to collect high-quality data on those roads most frequently driven by NDS participants and on roads of greatest interest to safety researchers. Guidance was developed both for the allocation of total road data collection mileage apportioned to each of the six NDS sites and for allocation within each study area. Allocation within each study area was determined using a sample of global positioning system (GPS) traces from the NDS participants’ vehicles and focused on rural two-lane roads. Coverage for each NDS site is provided below.
Miles Collected in the Mobile Data Collection Project
A major effort throughout this project was providing coordination and quality assurance (QA) for the collection and delivery of data by the mobile data collection vendor. For this purpose, a QA plan was developed. This plan outlined the processes to ensure optimum data quality from project setup to final data delivery and acceptance by SHRP 2. In addition, the QA plan defined the accuracy requirements and tolerances for what was deemed a non-conforming product and the process to deal with a non-conforming product. The QA process involved random site visits. Ground truth reference measurements were taken in the field throughout the project period, and a custom process was developed for checking and analyzing the accuracy of the mobile data by using GIS tools. In addition, to ensure the data collection equipment was operating properly, control sites were set up in each of the six NDS sites. The vendor collected data on these control sites during specific stages in the data collection cycle, and the research team verified the results against ground truth data.
The mobile data collection project covered about 12,500 centerline miles in the six NDS sites. Because data were collected in both directions of travel, a total of approximately 25,000 miles was provided. Below are summary statistics from the mobile data collection project. These data were collected consistently and within project specifications across the six NDS sites.
- 25,076 total miles of roadway data collected
- Total number of assets, including grade and cross-slope points: 7,524,310
- 44,114 curves
- 6,129 miles of barriers
- 43,195 intersections
- 7,376 miles of highway lighting
- 10,756 miles of medians
- 33,013 miles of paved and unpaved shoulders (this number includes inside and outside shoulders on four-lane divided roads)
- 11,852 miles of rumble strips
- 518,570 total signs
Other Data Sources
In addition to the data from the mobile data collection project, roadway data from existing public resources (e.g., Highway Performance Monitoring System [HPMS] data and comprehensive data items available from state transportation agencies) and a list of supplemental data items were acquired and included in the RID. The term “supplemental” refers to any data item that characterizes a roadway segment that was not included as part of the mobile data collection undertaken by SHRP 2 or existing roadway data acquired from transportation agencies within the six NDS sites. These supplemental items included crash histories, traffic, weather, work zones, changes to infrastructure, aerial imagery, Federal Railroad Administration (FRA) grade crossings, safety enforcement laws, and active safety campaigns. The existing and supplemental data that were acquired are estimated to cover about 200,000 centerline miles within the six NDS sites.
Database Design
The RID design is a simplified version of the revised Unified Network-Transportation (UNETRANS) network data model. Data models, technical specifications, and supporting management components were developed to define the RID and to ensure its interoperability with the NDS database. The RID was built on an underlying, route measure-based linear referencing system (LRS). Other roadway features, such as those collected as part of the mobile data collection project, have been conflated to this LRS and are represented as individual features within an Esri ArcGIS Geodatabase. Each feature also possesses corresponding LRS-based route and measure values. Therefore, the RID supports both attribute- and spatial-based queries as well as dynamic segmentation. Even though the RID is built as an Esri ArcGIS Geodatabase, other GIS software users can still utilize the RID.
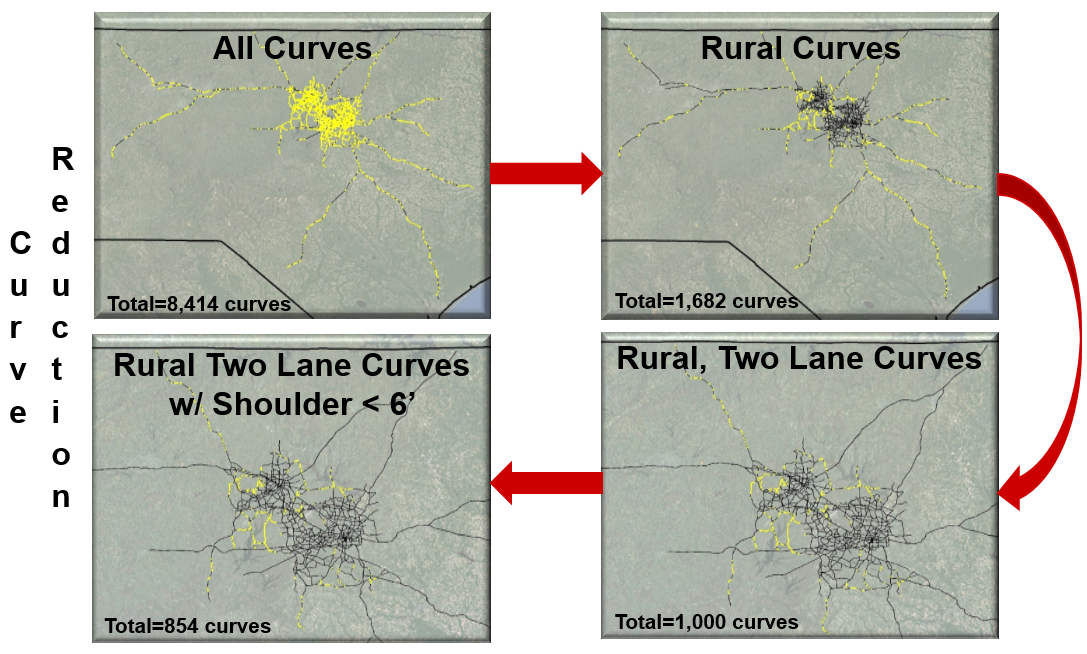
All the data contained in the RID are referenced to a national basemap, which provides a consistent centerline across the six NDS sites. This design allows the users, through the process of dynamic segmentation, to produce road segments with any variable of interest from the various data sets contained in the RID. Figure ES.1 shows an example of using dynamic segmentation to select two-lane rural curves in North Carolina with paved shoulders less than 6 ft. Figure below shows how out of 8,414 total curves, only 854 curves meet the selection criteria, which in turn helps focus the research questions and provide a more efficient and convenient process to request NDS data.
When the RID is completed in December 2014, a user guidance document, which includes data sources, query examples, roadway-linked NDS data examples, and a step-by-step process to integrate additional data into the RID, will be provided along with the database. In the meantime, please see Appendix F, which provides a step-by-step process on selecting specific roadway characteristics using RID and dynamic segmentation.
Conclusion
Overall, the RID design and included roadway data achieved the project goals and objectives. The addition of the supplemental data to the RID enhances the users’ ability to conduct a more comprehensive analysis than just roadway inventory data could provide. Using a consistent and comprehensive road network has provided the users of the RID and NDS the ability to conduct analysis across multiple sites. In addition, the RID design provides a template that transportation agencies can use in considering how to integrate disparate data to support safety, asset management, planning, and operations activities.